Each Starsim module can have its own results, which get added to the full list of results in the Sim object. For example, the ss.Pregnancy module adds results like sim.results.pregnancy.pregnant, and the ss.HIV module adds results like sim.results.hiv.new_infections. If you are writing your own module, you can add whatever custom results you want. However, another option is to create an Analyzer to store results that you might need for one particular analysis but won’t need all the time. An Analyzer is very similar to other Starsim modules in its structure, but the general idea of an analyzer is that it gets called at the end of a timestep, and reports of the state of things after everything else has been updated without changing any of the module states itself.
Simple usage
For simple reporting, it’s possible to use a single function as an analyzer. In this case, the function receives a single argument, sim, which it has full access to. For example, if you wanted to know the number of connections in the network on each timestep, you could write a small analyzer as follows:
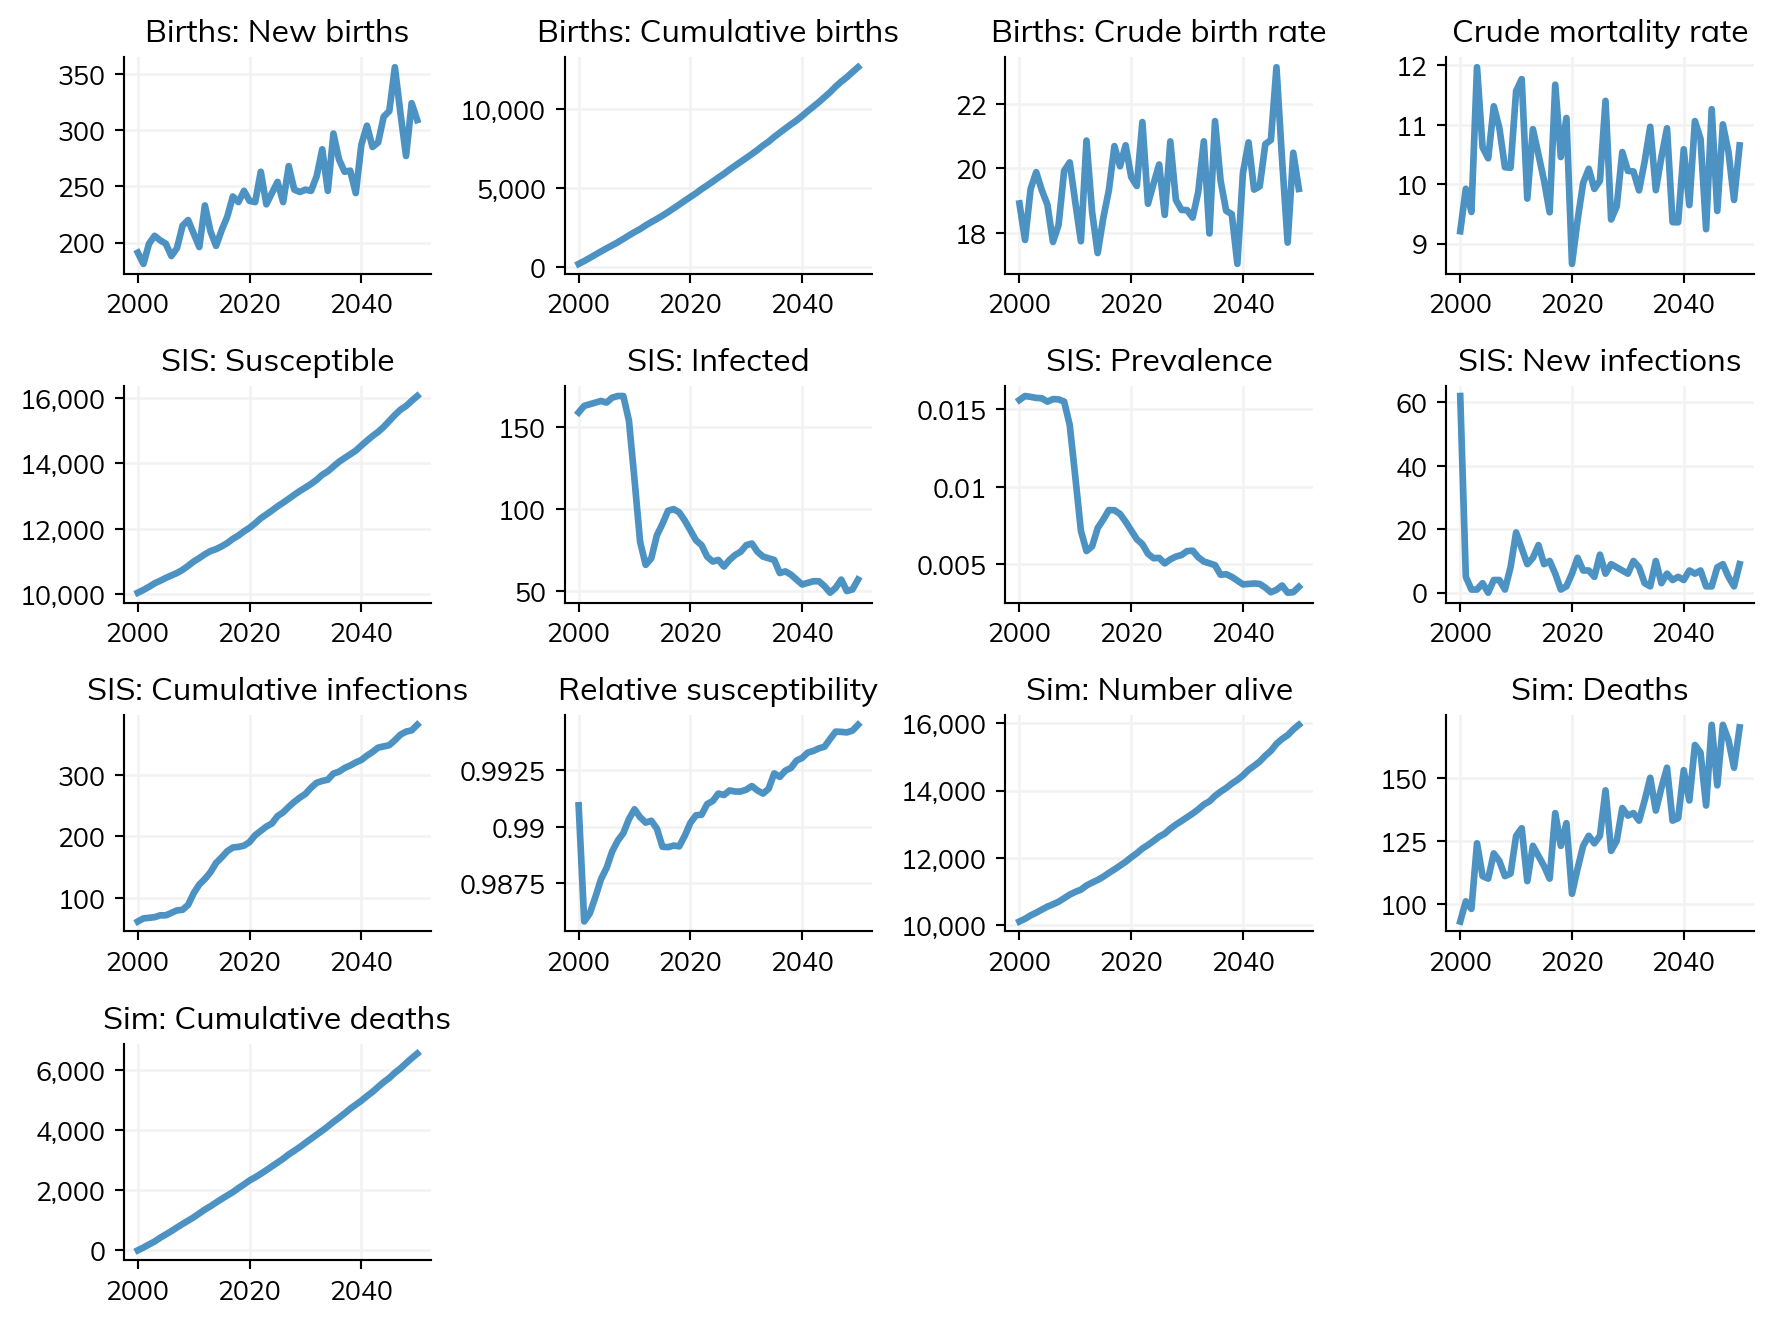
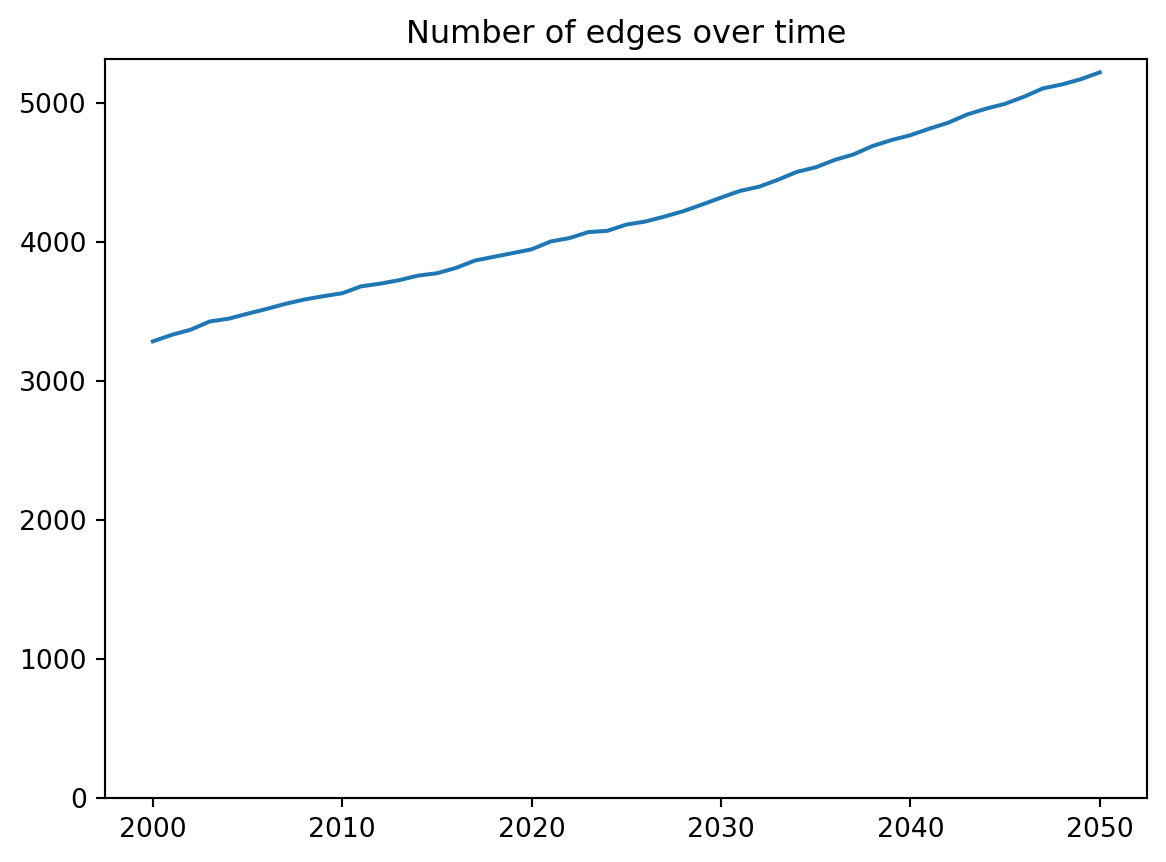
import numpy as npimport starsim as ssimport matplotlib.pyplot as pltss.options(jupyter=True)# Store the number of edgesn_edges = []def count_edges(sim):""" Print out the number of edges in the network on each timestep """ network = sim.networks[0] # Get the first network n =len(network) n_edges.append(n)print(f'Number of edges for network {network.name} on step {sim.ti}: {n}')return# Create the simpars =dict( diseases ='sis', networks ='mf', analyzers = count_edges, demographics =True,)# Run the simsim = ss.Sim(pars).run()sim.plot()# Plot the number of edgesplt.figure()plt.plot(sim.timevec, n_edges)plt.title('Number of edges over time')plt.ylim(bottom=0)plt.show()
Initializing sim with 10000 agents

  Running 2000 ( 0/51) (0.00 s)  ———————————————————— 2%
Number of edges for network mfnet on step 0: 3309
Number of edges for network mfnet on step 1: 3342
Number of edges for network mfnet on step 2: 3378
Number of edges for network mfnet on step 3: 3405
Number of edges for network mfnet on step 4: 3444
Number of edges for network mfnet on step 5: 3464
Number of edges for network mfnet on step 6: 3504
Number of edges for network mfnet on step 7: 3545
Number of edges for network mfnet on step 8: 3577
Number of edges for network mfnet on step 9: 3611

  Running 2010 (10/51) (0.07 s)  ••••———————————————— 22%
Number of edges for network mfnet on step 10: 3633
Number of edges for network mfnet on step 11: 3660
Number of edges for network mfnet on step 12: 3697
Number of edges for network mfnet on step 13: 3719
Number of edges for network mfnet on step 14: 3759
Number of edges for network mfnet on step 15: 3801
Number of edges for network mfnet on step 16: 3844
Number of edges for network mfnet on step 17: 3890
Number of edges for network mfnet on step 18: 3925
Number of edges for network mfnet on step 19: 3956

  Running 2020 (20/51) (0.13 s)  ••••••••———————————— 41%
Number of edges for network mfnet on step 20: 3991
Number of edges for network mfnet on step 21: 4036
Number of edges for network mfnet on step 22: 4076
Number of edges for network mfnet on step 23: 4116
Number of edges for network mfnet on step 24: 4145
Number of edges for network mfnet on step 25: 4195
Number of edges for network mfnet on step 26: 4241
Number of edges for network mfnet on step 27: 4274
Number of edges for network mfnet on step 28: 4337
Number of edges for network mfnet on step 29: 4378

  Running 2030 (30/51) (0.19 s)  ••••••••••••———————— 61%
Number of edges for network mfnet on step 30: 4424
Number of edges for network mfnet on step 31: 4467
Number of edges for network mfnet on step 32: 4498
Number of edges for network mfnet on step 33: 4516
Number of edges for network mfnet on step 34: 4554
Number of edges for network mfnet on step 35: 4618
Number of edges for network mfnet on step 36: 4663
Number of edges for network mfnet on step 37: 4706
Number of edges for network mfnet on step 38: 4749
Number of edges for network mfnet on step 39: 4814

  Running 2040 (40/51) (0.25 s)  ••••••••••••••••———— 80%
Number of edges for network mfnet on step 40: 4859
Number of edges for network mfnet on step 41: 4867
Number of edges for network mfnet on step 42: 4904
Number of edges for network mfnet on step 43: 4974
Number of edges for network mfnet on step 44: 5029
Number of edges for network mfnet on step 45: 5087
Number of edges for network mfnet on step 46: 5121
Number of edges for network mfnet on step 47: 5172
Number of edges for network mfnet on step 48: 5236
Number of edges for network mfnet on step 49: 5287

  Running 2050 (50/51) (0.32 s)  •••••••••••••••••••• 100%

Number of edges for network mfnet on step 50: 5336
Figure(896x672)
Advanced usage
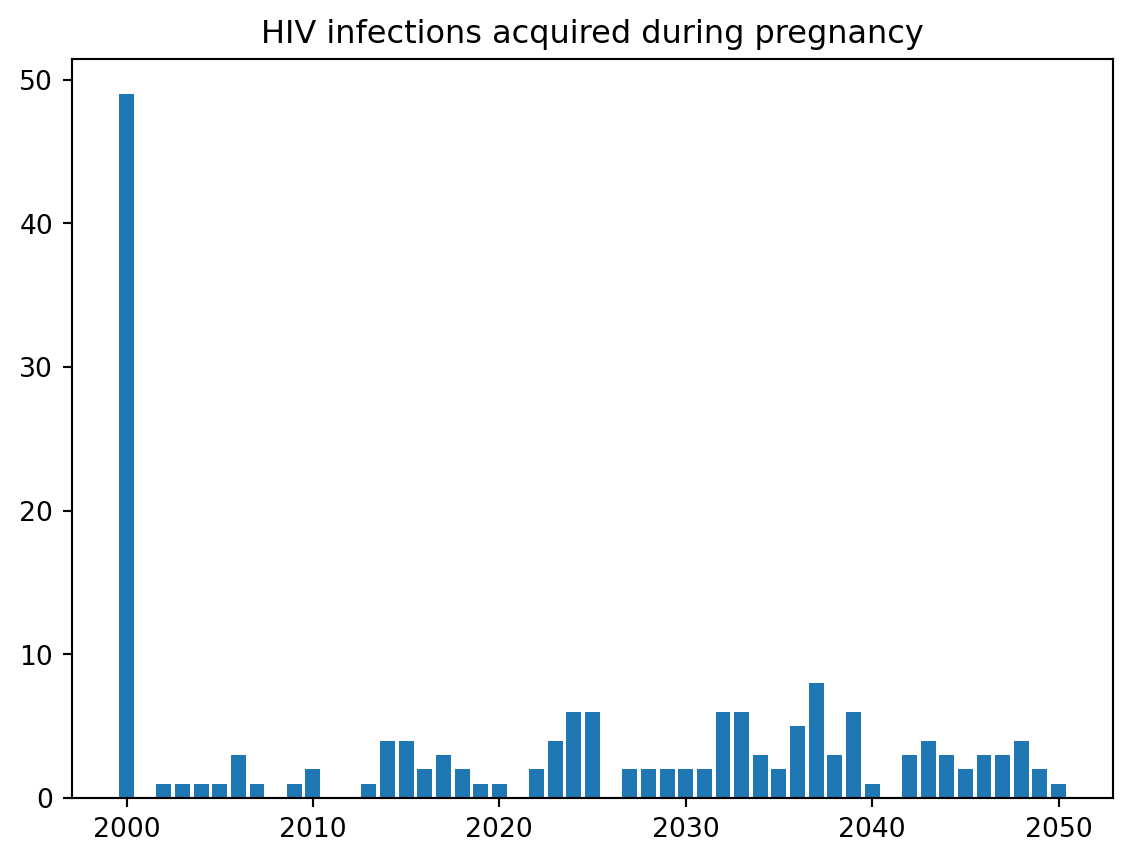
Suppose we wanted to create an analyzer that would report on the number of new HIV infections in pregnant women:
import starsim as ssimport starsim.library as sslimport pandas as pdclass HIV_preg(ss.Analyzer):def__init__(self, *args, **kwargs):super().__init__(*args, **kwargs)returndef init_results(self):super().init_results()self.define_results( ss.Result('new_infections_pregnancy'), )returndef step(self): sim =self.sim ti = sim.ti hiv = sim.diseases.hiv pregnant = sim.demographics.pregnancy.pregnant newly_infected = hiv.ti_infected == tiself.results['new_infections_pregnancy'][ti] =len((newly_infected & pregnant).uids)returnpregnancy = ss.Pregnancy(fertility_rate=pd.read_csv('test_data/nigeria_asfr.csv'))hiv = ssl.diseases.HIV(beta={'mfnet':[0.5,0.25]})sim = ss.Sim(diseases=hiv, networks='mfnet', demographics=pregnancy, analyzers=HIV_preg())sim.run()print(f'Total infections among pregnant women: {sim.results.hiv_preg.new_infections_pregnancy.sum()}')
Analyzers are ideal for adding custom results, and because they get added to the sim in the same way as any other result, they also get automatically exported in the same format, e.g. using sim.to_df().
Here’s a plot of the results from our HIV in pregnancy analyzer:
import matplotlib.pyplot as pltres = sim.results.hiv_pregplt.figure()plt.bar(res.timevec.years, res.new_infections_pregnancy)plt.title('HIV infections acquired during pregnancy')plt.show()
Built-in analyzers
Starsim comes with two built-in analyzers, an infection log and an age analyzer.
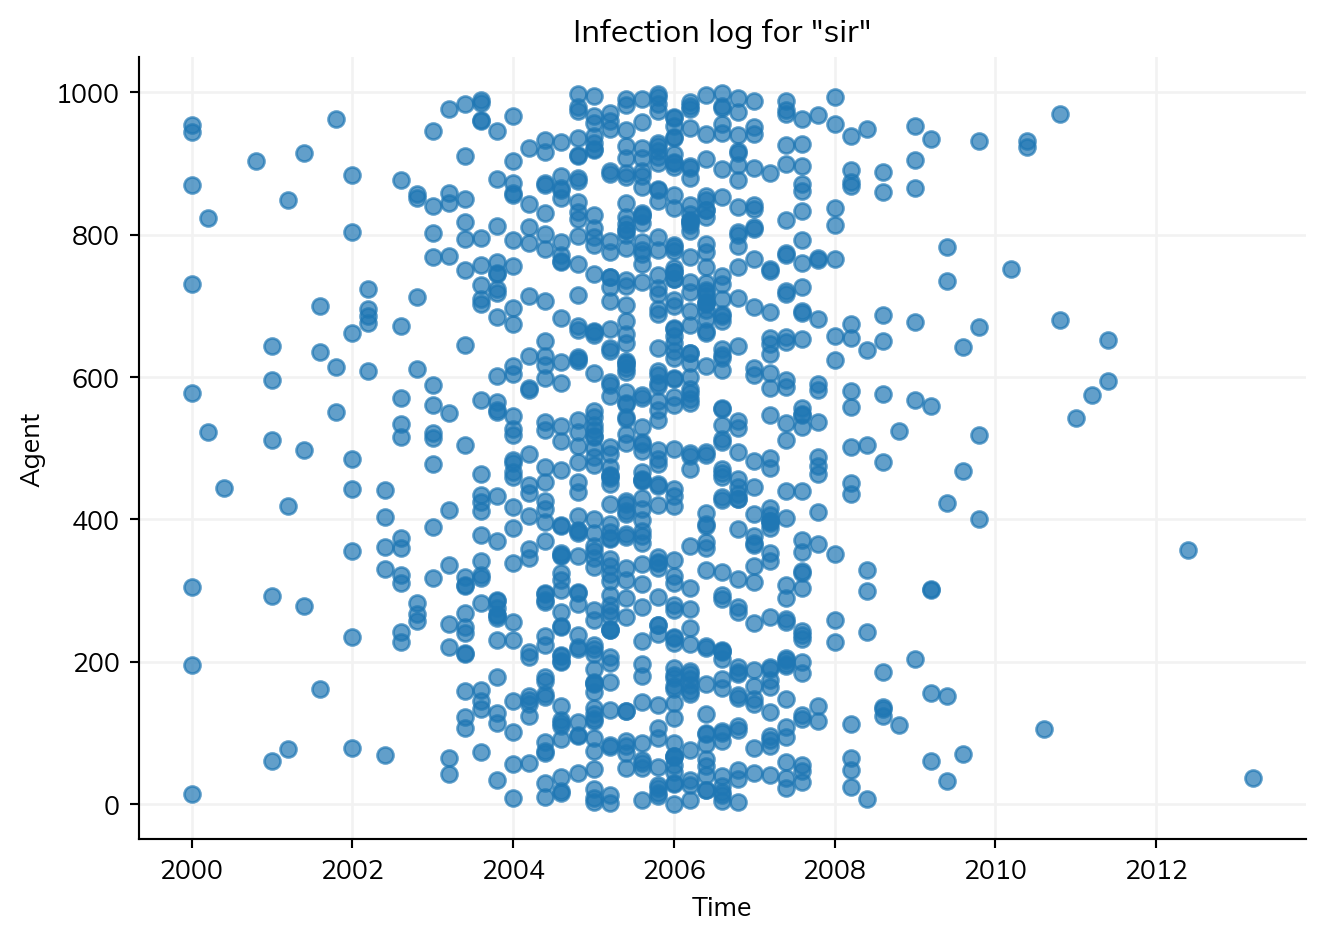
Infection log
The infection log produces a line list of infections. It’s integrated into the logic of ss.Disease in order to track infection sources and targets, which are not kept beyond this (for memory reasons).
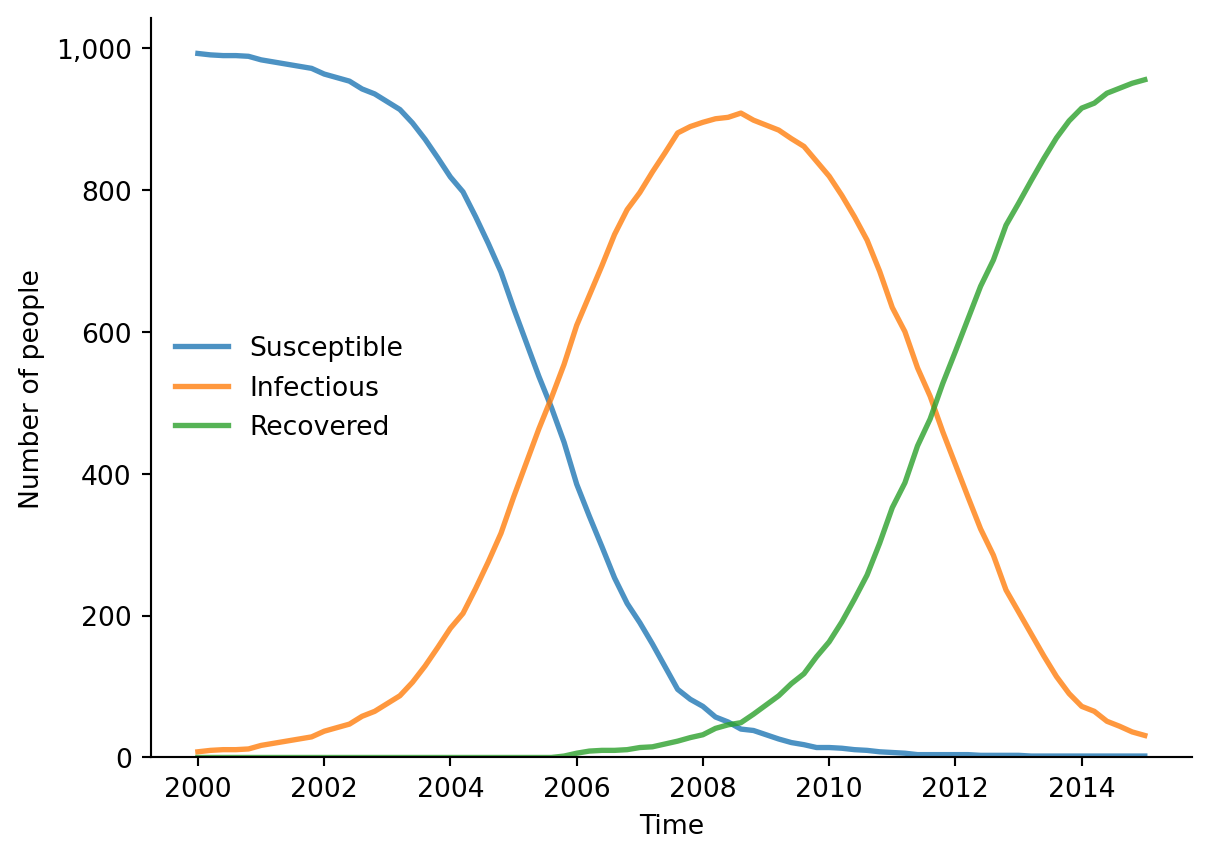
You can see how this raster plot aligns with the peak of infections:
sim.diseases.sir.plot()
Figure(672x480)
(Note: ss.infection_log() also has an .animate() method, which we will leave for you to try out!)
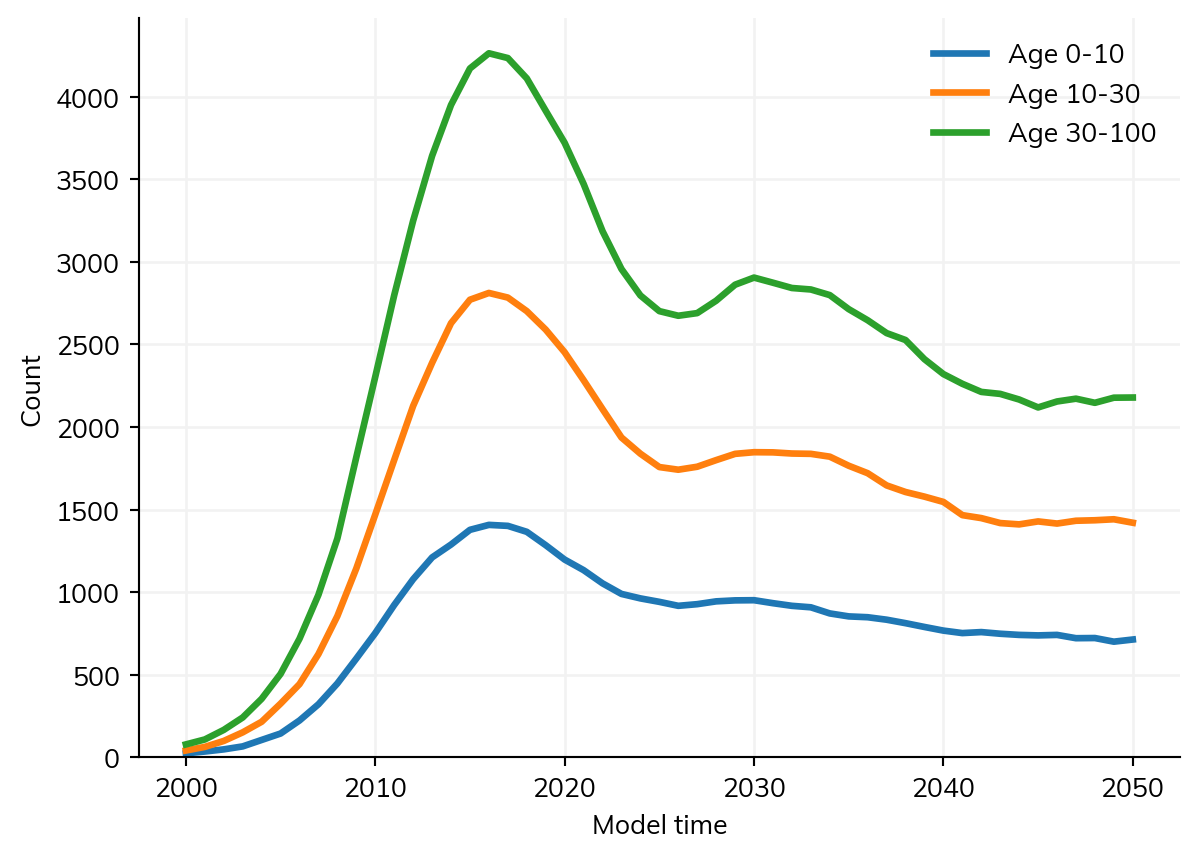
Dynamics by age
This analyzer illustrates how you could track infections by age. Since it illustrates some additional key principles of building analyzers, here it is in full:
Since we are using a random network, we wouldn’t expect any differences in transission by age, so what you’re seeing here is the difference in age bin size.