Diseases are the cornerstone of almost any Starsim analysis. In this tutorial, you’ll learn how to work with diseases in Starsim, starting with simple modifications and building up to creating your own custom disease models.
By the end of this tutorial, you’ll understand how to: - Modify parameters of existing diseases - Run simulations with multiple diseases - Create your own custom disease from scratch
Step 1: Modifying disease parameters
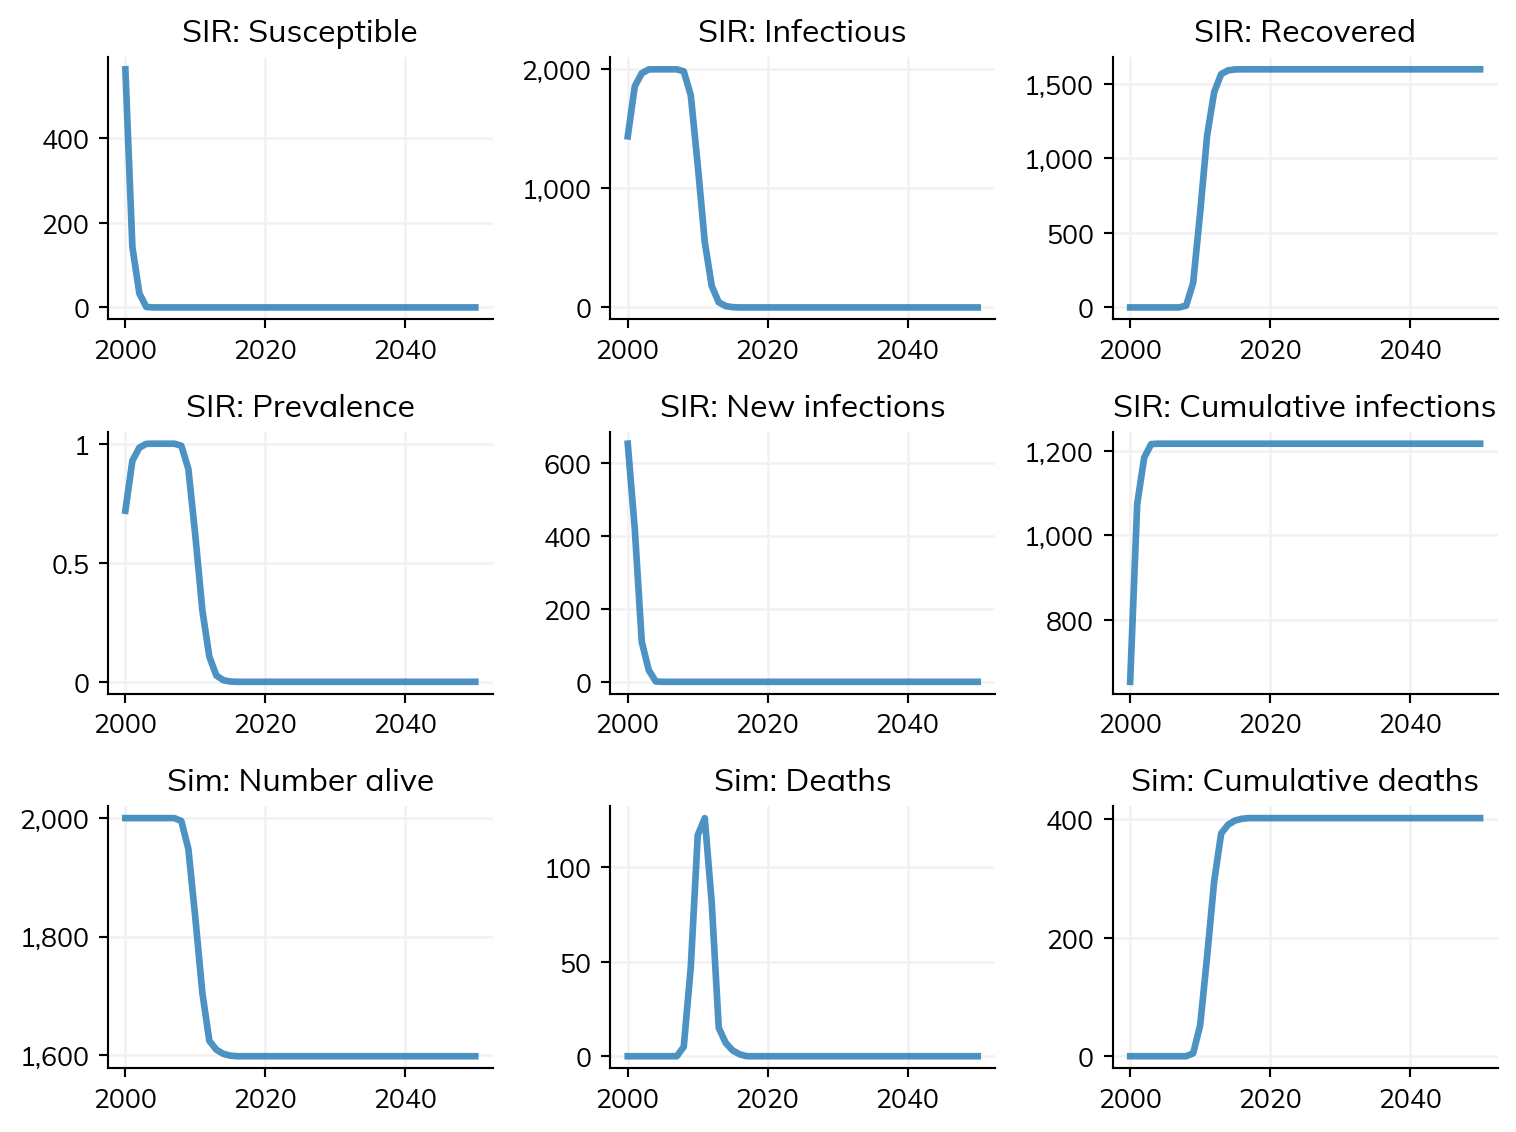
The easiest way to customize a disease is by changing its parameters. Much like sims or networks, a Disease can be customized by passing in a pars dictionary containing parameters. Let’s start with a simple SIR model and see how different parameters affect the simulation:
Notice how we modified several key parameters: - dur_inf=10: How long people stay infectious (10 years) - beta=0.2: Transmission probability per contact - init_prev=0.4: Starting with 40% of the population infected - p_death=0.2: 20% of infected people die
We already saw that this model creates results that are stored in sim.results.sir. The results can also be directly accessed via sir.results.
For more detail on any of the diseases that are in the Starsim library of diseases, please refer to the docstrings and source code of the disease files.
Step 2: Simulating multiple diseases
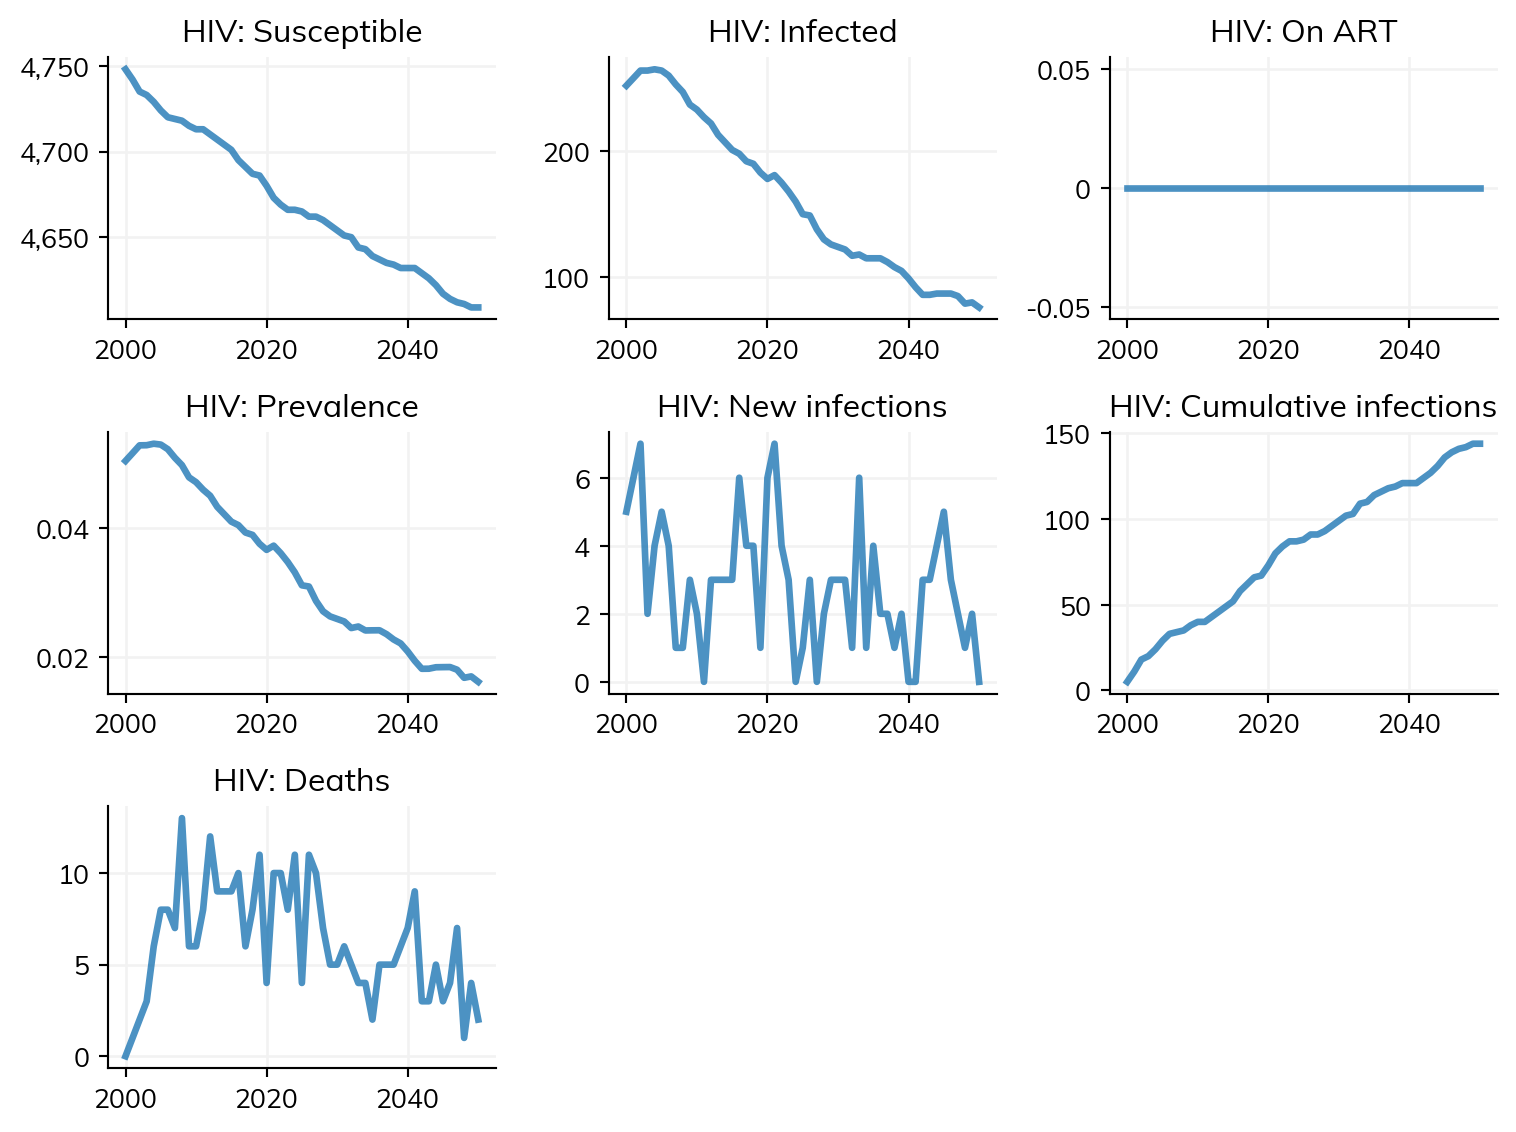
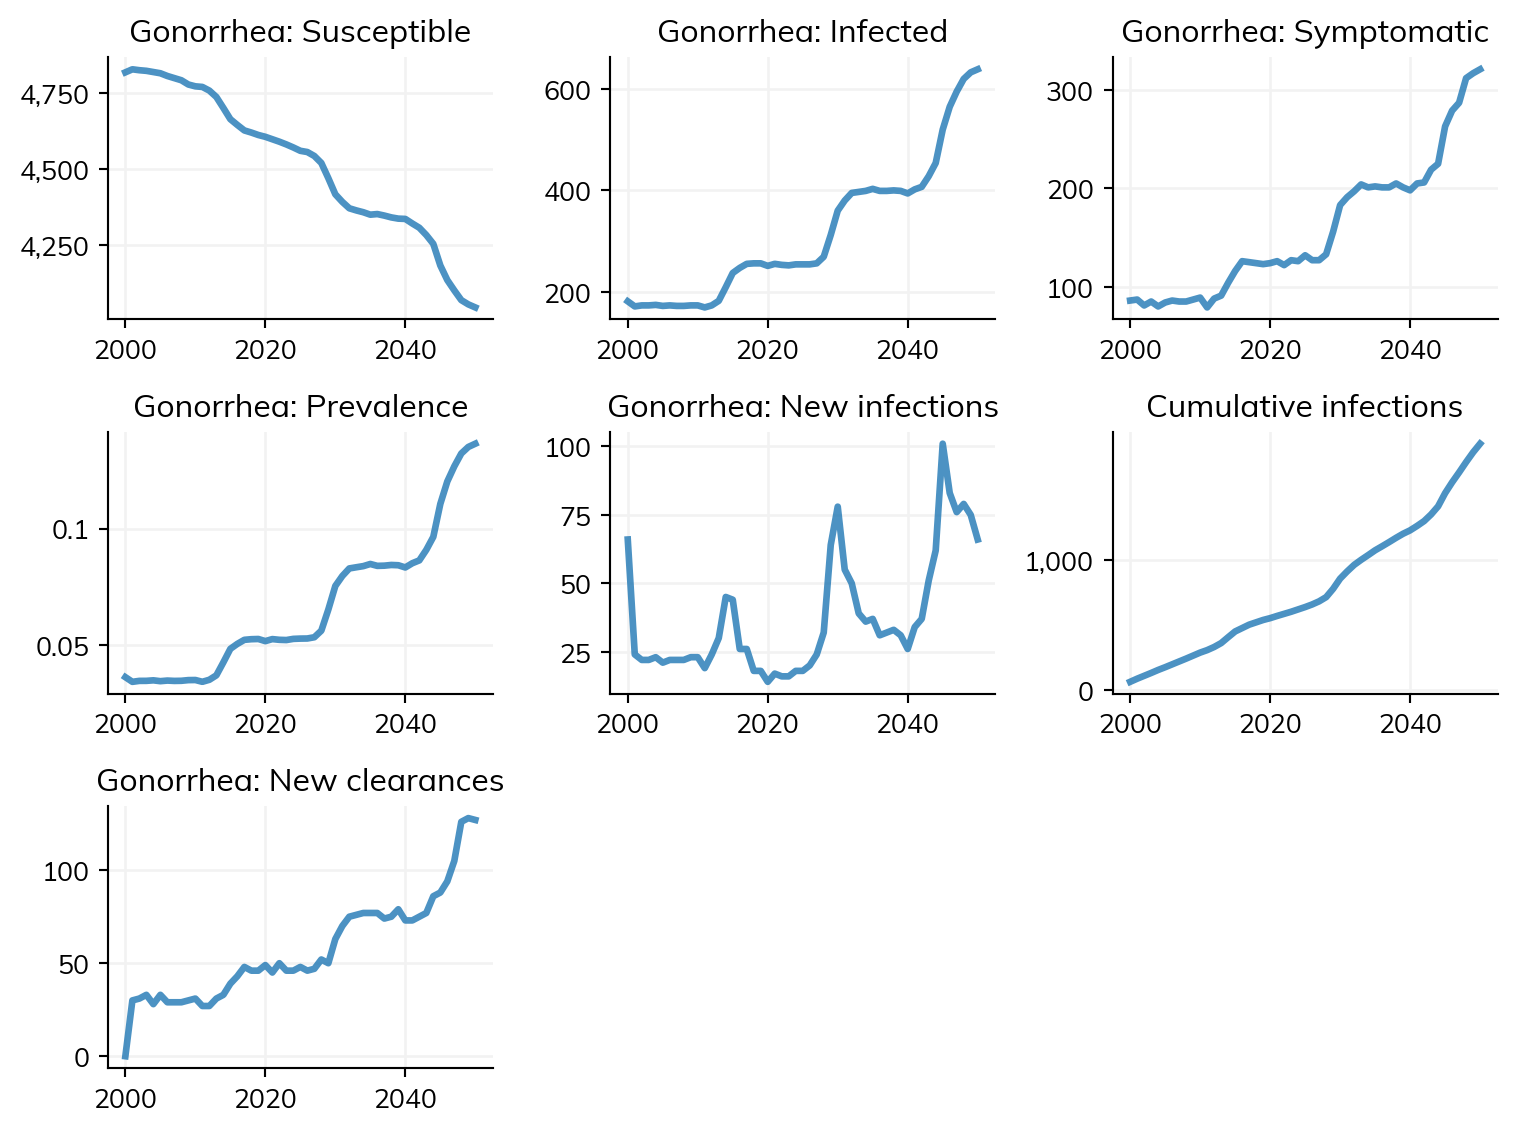
You can add multiple diseases to the same simulation, like so. Here we are making use of a “connector”. A connector is a module in Starsim that tells you how two things relate to one another - in this case, how HIV modifies a person’s transmissibility and susceptibility to SIS and vice versa. Unlike dieases, networks, interventions, etc., connectors don’t have any pre-specified location in the sim. Instead, they can be placed wherever they make the most sense (for example, a connector that mediated how two networks behaved might be placed at the beginning or end of the list of networks; for diseases, it might be placed at the beginning or end of the list of diseases).
import starsim as ssimport starsim.library as sslclass simple_hiv_sis(ss.Module):""" Simple connector whereby rel_sus to SIS doubles if CD4 count is <200"""def__init__(self, pars=None, label='HIV-SIS', **kwargs):super().__init__()self.define_pars( rel_trans_hiv =2, rel_trans_aids =5, rel_sus_hiv =2, rel_sus_aids =5, )self.update_pars(pars, **kwargs)returndef step(self):""" Specify how HIV increases SIS rel_sus and rel_trans """ sis =self.sim.people.sis hiv =self.sim.people.hiv p =self.pars sis.rel_sus[hiv.cd4 <500] = p.rel_sus_hiv sis.rel_sus[hiv.cd4 <200] = p.rel_sus_aids sis.rel_trans[hiv.cd4 <500] = p.rel_trans_hiv sis.rel_trans[hiv.cd4 <200] = p.rel_trans_aidsreturn# Make HIVhiv = ssl.diseases.HIV( beta = {'mf': [0.0008, 0.0004]}, # Specify transmissibility over the MF network init_prev =0.05,)# Make SISsis = ss.SIS( beta = {'mf': [0.05, 0.025]}, # Specify transmissibility over the MF network init_prev =0.025,)# Make the sim, including a connector between HIV and SIS:n_agents =5_000sim = ss.Sim(n_agents=n_agents, networks='mf', diseases=[simple_hiv_sis(), hiv, sis])sim.run()sim.plot('hiv')sim.plot('sis')
You can see how the two diseases interact - HIV creates a vulnerable population that’s more susceptible to SIS infection.
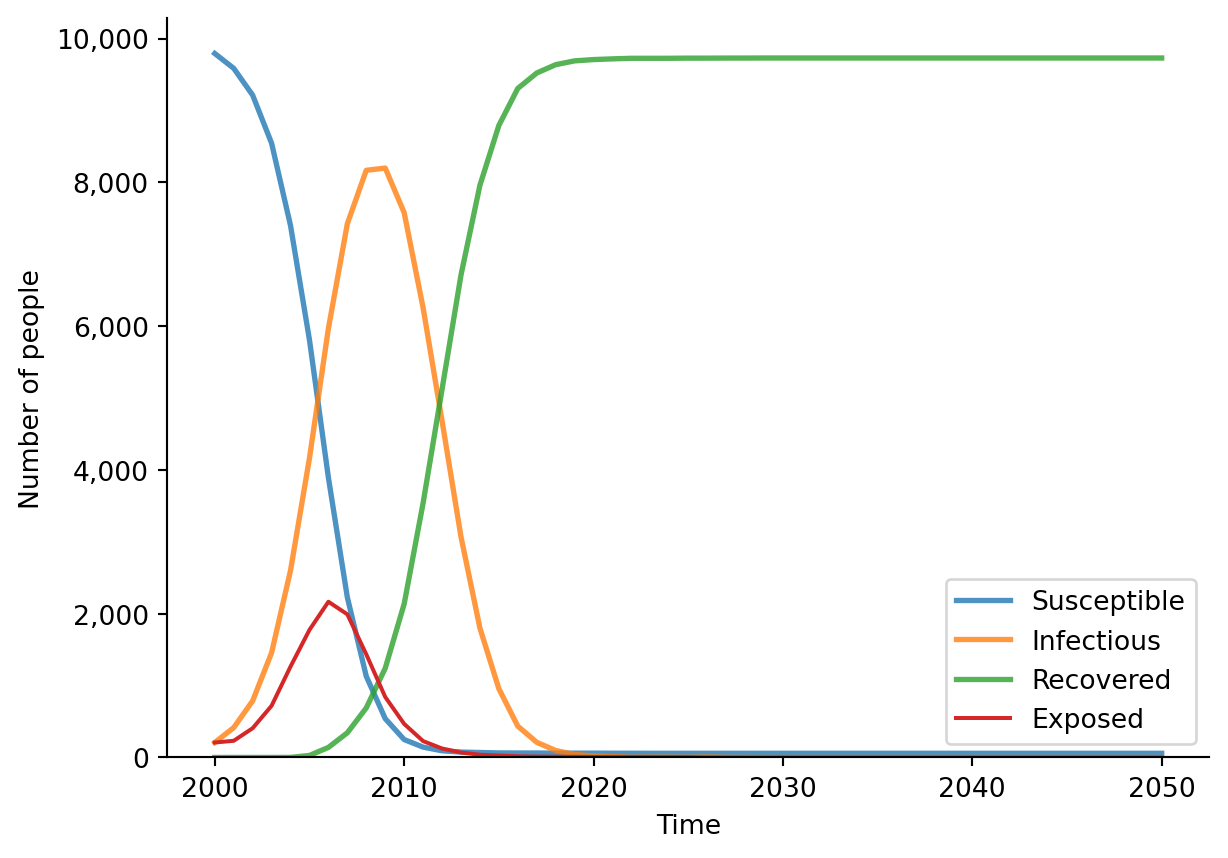
Step 3: Creating your own disease model
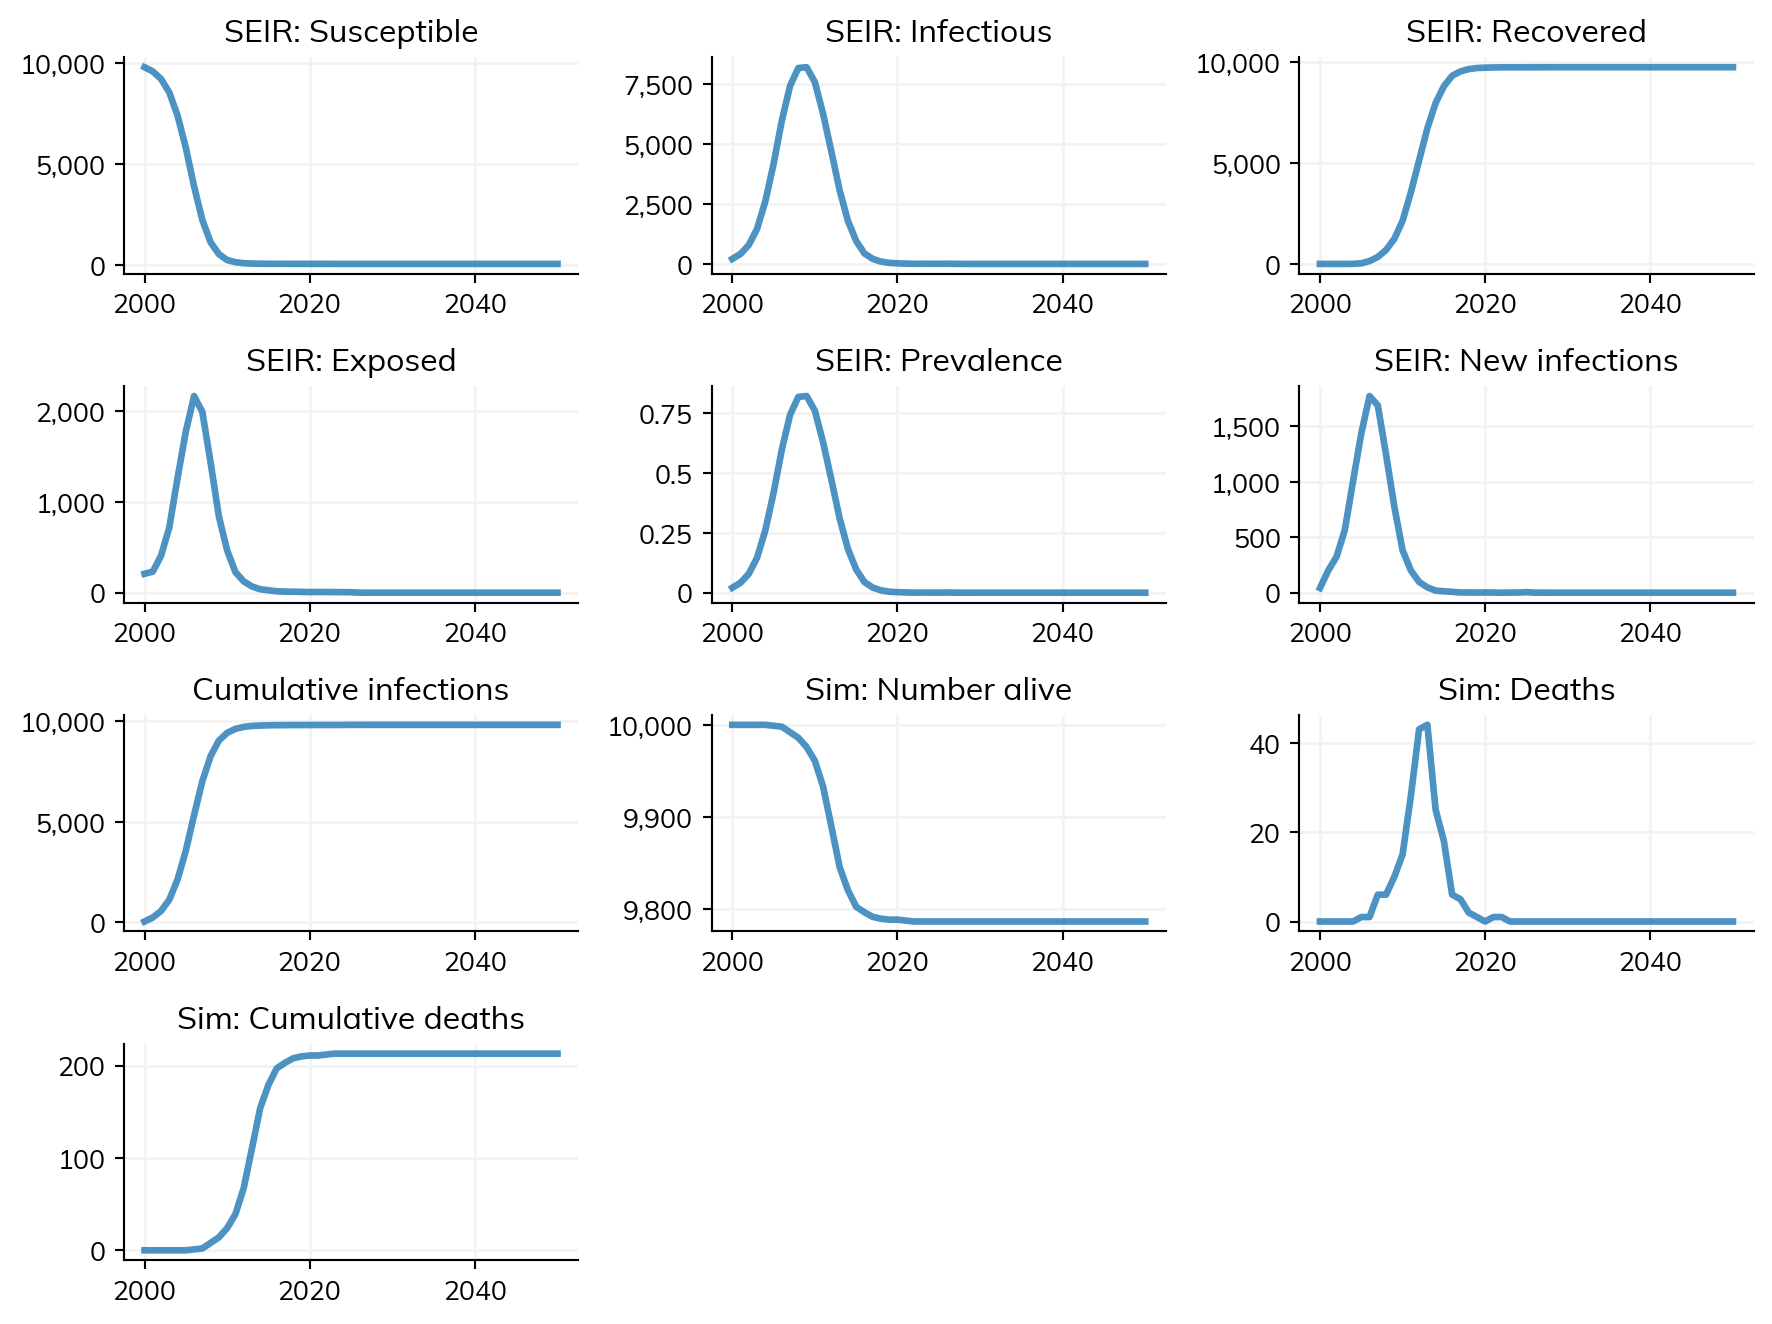
Now for the fun part - creating your own disease from scratch! Let’s modify the SIR model to create an SEIR model, which adds an “Exposed” state where people are infected but not yet infectious.
This is a common pattern in epidemiology - think of it as the incubation period before someone becomes contagious.
If you want to make your own disease, you could either inherit from one of the templates in diseases.py, or you could copy the examples and extend them to capture features of the disease that you want to model. For example, suppose you wanted to change the SIR model to an SEIR model (i.e., add an ‘exposed’ state where people were transmissible but did not yet have symptoms. You might hope that this would be a relatively simple change to make. Here’s how it would look:
import starsim as ssimport matplotlib.pyplot as pltclass SEIR(ss.SIR):def__init__(self, pars=None, *args, **kwargs):super().__init__()self.define_pars( dur_exp = ss.lognorm_ex(0.5), )self.update_pars(pars, **kwargs)# Additional states beyond the SIR ones self.define_states( ss.BoolState('exposed', label='Exposed'), ss.FloatArr('ti_exposed', label='TIme of exposure'), )return@propertydef infectious(self):returnself.infected |self.exposeddef step_state(self):""" Make all the updates from the SIR model """# Perform SIR updatessuper().step_state()# Additional updates: progress exposed -> infected infected =self.exposed & (self.ti_infected <=self.ti)self.exposed[infected] =Falseself.infected[infected] =Truereturndef step_die(self, uids):super().step_die(uids)self.exposed[uids] =Falsereturndef set_prognoses(self, uids, sources=None):""" Carry out state changes associated with infection """super().set_prognoses(uids, sources) ti =self.tiself.susceptible[uids] =Falseself.exposed[uids] =Trueself.ti_exposed[uids] = ti# Calculate and schedule future outcomes p =self.pars # Shorten for convenience dur_exp = p.dur_exp.rvs(uids)self.ti_infected[uids] = ti + dur_exp dur_inf = p.dur_inf.rvs(uids) will_die = p.p_death.rvs(uids) self.ti_recovered[uids[~will_die]] = ti + dur_inf[~will_die]self.ti_dead[uids[will_die]] = ti + dur_inf[will_die]returndef plot(self):""" Update the plot with the exposed compartment """with ss.options.context(show=False): # Don't show yet since we're adding another line fig =super().plot() ax = plt.gca() res =self.results.n_exposed ax.plot(res.timevec, res, label=res.label) plt.legend()return ss.return_fig(fig)
The new class includes the following main changes:
In __init__ we added the extra pars and states needed for our model
We defined infectious to include both infected and exposed people - this means that we can just reuse the existing logic for how the SIR model handles transmission
We updated update_pre and update_death to include changes to the exposed state
We rewrote set_prognoses to include the new exposed state.